

Top 15 Cloud Observability Tools: Hybrid, Multi-Cloud, & Open Source

Table of Contents

Modern engineering organizations operate in a world where performance is often synonymous with business success. As systems migrate from monolithic architectures to highly distributed microservices, the ability to understand internal system states has become a critical competitive advantage. While access to cloud computing resources is effectively limitless, the complexity of managing these environments has grown exponentially.
Relying on traditional monitoring—which tracks “known knowns” through static dashboards—is no longer sufficient. Today, organizations are adopting cloud observability tools to gain deep, actionable insights into system behavior, ensuring they maintain control over budget, security, and performance.
Key Takeaways
- Defining Observability: Unlike monitoring, which is reactive, observability is proactive, allowing engineers to understand “why” a system is behaving a certain way by analyzing metrics, logs, and traces.
- Telemetry at Scale: Modern systems require the correlation of high-cardinality signals across ephemeral infrastructure like Kubernetes and serverless functions.
- Strategic Tooling: Selecting an observability platform is a category decision—single-cloud, hybrid, and multi-cloud environments each require specific technical capabilities.
What Is Cloud Observability?
Cloud observability is the ability to measure a system’s internal state based on the external data it generates—specifically metrics, logs, and traces. Unlike traditional monitoring, which simply alerts you when a predefined threshold is crossed, observability allows you to ask questions about system behavior that you didn’t know you needed to ask.
The Three Pillars of Observability
To achieve full visibility, modern organizations rely on three primary telemetry signals. These pillars work together to provide the context necessary for debugging distributed systems.
| Pillar | Description | Use Case |
| 1. Metrics | Numerical data measured over intervals of time. | Tracking system health like CPU usage or request rates. |
| 2. Logs | Immutable, timestamped records of discrete events. | Investigating specific errors or verifying detailed event history. |
| 3. Traces | Data that tracks the path of a request through distributed services. | Finding bottlenecks in microservices or service-to-service communication. |
Observability in Cloud vs. Traditional Monitoring
Traditional monitoring is typically host-centric, focusing on whether individual servers are up or down. Monitoring tools track predefined metrics—known failure modes—and alert teams when a threshold is breached.
Cloud-native observability, however, is service-centric. It focuses on the interactions between microservices, API calls, and dynamic infrastructure. Monitoring in a cloud environment means a server might be healthy (CPU and RAM are normal), but a user may still experience high latency due to a slow third-party API or a misconfigured container. Observability provides the “connective tissue” to see these relationships.
Why Cloud Observability Matters in Distributed Systems
Distributed systems introduce massive complexity. Ephemeral resources like containers and serverless functions appear and disappear in seconds, making it impossible to debug issues using traditional host-centric methods. Without cloud observability tools, engineering teams face:
- Ephemeral Data Loss: If a container crashes and is terminated, local logs are often lost forever unless they are being streamed to a centralized observability platform.
- Microservice Sprawl: In a system with hundreds of microservices, identifying which specific service is the bottleneck requires distributed tracing to follow a request’s journey across service boundaries.
- Kubernetes Complexity: Managing ever-changing network topologies in Kubernetes is “table stakes” for modern reliability; observability tools provide the real-time auto-discovery needed to track these dynamic workloads.
From Monitoring to Cloud Observability Platforms
The evolution from host-centric monitoring to modern cloud observability platforms represents a fundamental shift in how organizations manage digital health. Monitoring has historically been built to track “known-unknowns”—specific metrics that engineers already know might fail, such as CPU utilization or disk space. While this was effective for static, monolithic architectures, it lacks the depth required for today’s distributed systems.
The Evolution of Insight
In the past, monitoring provided a binary view: is the system up or down? As systems moved toward microservices and ephemeral infrastructure like Kubernetes, these static dashboards became insufficient. Modern observability has evolved to address “unknown-unknowns”—problems that engineers haven’t encountered before and couldn’t have predicted. This transition moves teams from simply observing a symptom to having the forensic data needed to understand the root cause.
Reducing MTTU and MTRR
The primary goal of modern cloud observability tools is to drastically reduce the Mean Time to Understanding (MTTU) and Mean Time to Resolution (MTTR).
- Contextual Depth: Traditional monitoring identifies that a problem exists, but observability uses correlated telemetry (metrics, logs, and traces) to explain why it exists.
- Service-Centric Focus: Unlike host-centric tools that focus on individual servers, observability platforms monitor the health of the entire service flow, regardless of how many ephemeral containers or serverless functions are involved.
- Proactive Intelligence: By moving beyond static thresholds, these platforms use high-cardinality data to identify subtle patterns and performance degradations before they escalate into full system outages.
For high-performance environments, this evolution is critical. NZO Cloud enhances this visibility by providing bare-metal resources that eliminate the “performance fog” caused by virtualization, allowing these cloud observability tools to report on actual hardware behavior without the interference of a hypervisor.
While a vital tool, HPC deployments can come with challenges. Learn how to overcome them.Uncover the latest trends in AI cloud computing and how to leverage the power of AI.

How Cloud Observability Works in Practice
At its core, observability is an engineering discipline that relies on the continuous collection and analysis of telemetry data.
Core Telemetry Signals in Cloud Observability
- Metrics: Quantitative, numerical values measured over time (e.g., CPU utilization, request count, error rates).
- Logs: Timestamped, textual records of discrete events (e.g., “12:05:32 – Checkout failed, database timeout”).
- Traces: The end-to-end “story” of a single request from the moment it enters the system until it completes, crossing all internal and external dependencies.
- Events: Richer data types that capture specific system actions, often used for AI-driven anomaly detection.
High-cardinality data—such as tracking unique User IDs, Request IDs, or container versions—is the secret sauce of observability. It allows engineers to “slice and dice” data to find patterns, such as “Why is checkout slow only for users in Region X on Mobile App Version Y?”.
Correlating Signals Across Cloud-Native Architectures
In a cloud-native observability strategy, correlation matters more than raw data volume. It is not enough to have terabytes of logs; those logs must be linked to specific traces to provide context.
Best practices for correlation include:
- Context Propagation: Ensuring that a unique trace ID is passed along with every request as it moves through the infrastructure.
- Tagging and Metadata: Standardizing tags (e.g., environment, service, version) across all signals to enable unified filtering.
- Cross-Cloud Tracking: Measuring data transit performance at the boundaries between cloud providers and on-premise data centers.
Observability Cloud Tools vs. APM Tools
Application Performance Monitoring (APM) tools are excellent for optimizing code-level performance. However, cloud observability tools widen the aperture to include the entire IT infrastructure—including containers, cloud-native storage, and network latency. While APM tells you an application is slow, observability reveals that it is slow because a specific Kubernetes pod is being throttled by the underlying hardware.
How to Choose the Right Observability Category for Your Team

Choosing the “best tool” is often a category decision, not just a vendor decision. The right platform must align with your specific architecture and long-term roadmap.
Decision Framework
- Current Architecture: Are you single-cloud, hybrid, or multi-cloud? Single-cloud teams may prefer deep integration with their provider’s native services, while hybrid teams need tools that can bridge the gap between legacy servers and modern containers.
- 12-24 Month Roadmap: If your team plans to adopt Kubernetes or expand to multiple regions, your observability tool must support automated discovery and cross-regional correlation.
- Team Structure and Ownership: Does your organization prioritize developer-friendly, automated instrumentation (managed SaaS), or does your SRE team need granular control over data pipelines (open-source based)?
- Cost and Scale: Managed platforms often charge per seat or per gigabyte of ingested data, which can become prohibitive at scale. Organizations with massive data volumes often look for tools that offer telemetry control to reduce costs.
Top Cloud Observability Tools
Modern cloud observability tools are generally categorized by the environments they serve best.
Tools Summary Table
| Category | Top Tools | Primary Strength | Best For |
| General Cloud | Datadog, New Relic, Dynatrace, Elastic | Full-stack depth & native integrations | Single-cloud SaaS or product-led teams |
| Hybrid Cloud | SolarWinds, LogicMonitor, IBM Instana | Infrastructure continuity & hybrid awareness | Teams bridging on-prem data centers with cloud |
| Multi-Cloud | Grafana Labs, Chronosphere, AppDynamics, Lightstep | Standardization across providers & scale | Large enterprises using multiple hyperscalers |
| Open Source | Prometheus, OpenTelemetry, Jaeger, Zipkin | Vendor-neutrality & modularity | Platforms requiring deep custom control |
General Cloud Observability Tools
Best for single-cloud or cloud-native SaaS environments.
Datadog
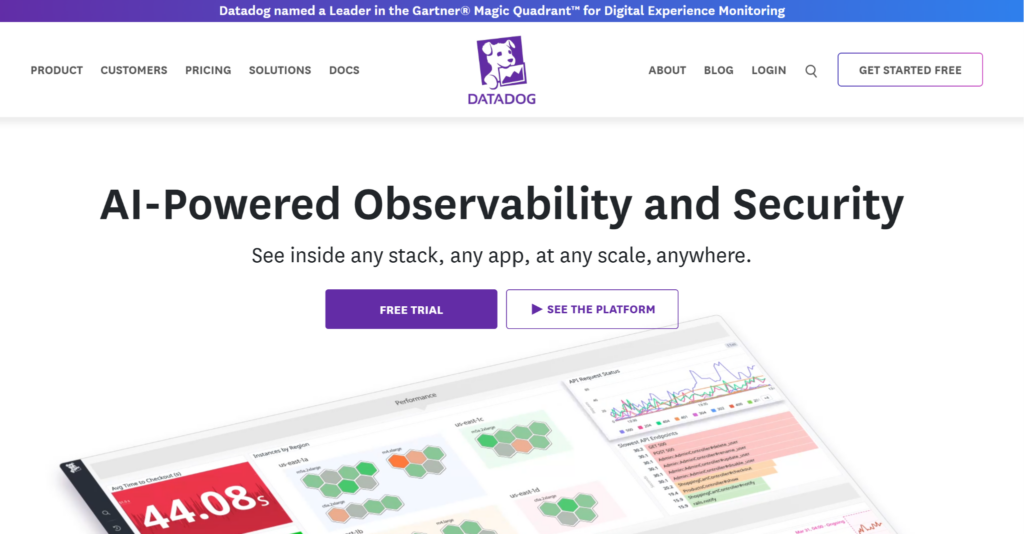
Datadog is a comprehensive platform providing unified visibility from networking and compute up to application logic and UX. It integrates metrics, logs, and traces into a single pane of glass, powered by AI capabilities for automated anomaly detection.
Key Observability Features:
- Unified full-stack visibility across platform scaffolding and application logic.
- Strong cloud-native integrations with Kubernetes and managed services.
- Popular with high-growth, product-driven engineering teams.
New Relic
New Relic offers a massively scalable platform designed to ingest and correlate all data in context, featuring strong APM roots. It enables faster root cause analysis by unifying telemetry via OpenTelemetry and providing developer-friendly instrumentation.
Key Observability Features:
- Application-first observability with deep APM capabilities.
- Unified telemetry through native OpenTelemetry support.
- Instrumentation designed to prioritize developer workflows.
Dynatrace
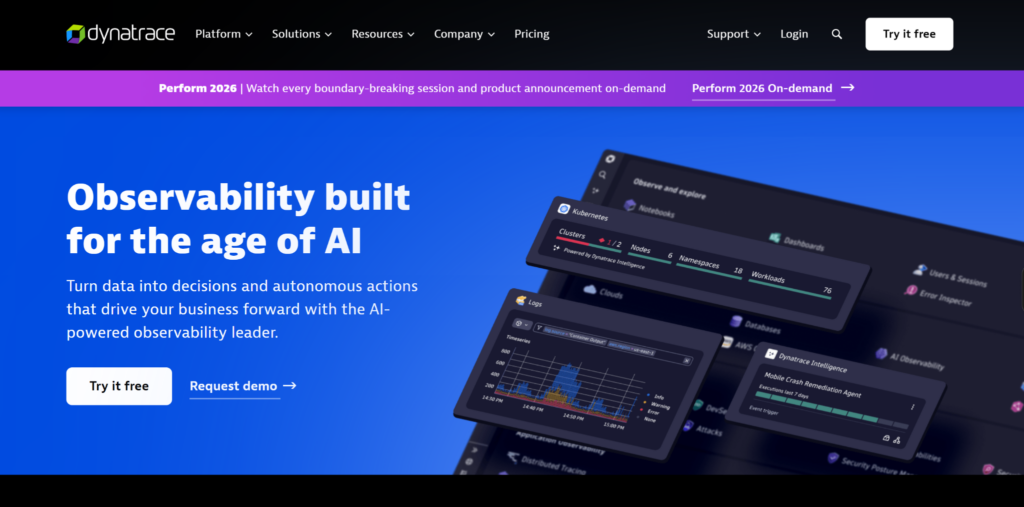
Dynatrace uses deterministic causal AI to provide automated root-cause analysis across billions of dependencies. Its modular architecture creates a real-time topology map of your entire environment, automatically identifying how applications and infrastructure interact.
Key Observability Features:
- Smartscape real-time topology and dependency mapping.
- AI-driven anomaly detection and automated problem resolution.
- Deep enterprise penetration with specialized support for complex orgs.
Elastic

Elastic provides a logs-first observability approach built on an open-core ecosystem, known for its powerful search and correlation. It helps teams ingest high-fidelity event data for exploratory queries into system behavior.
Key Observability Features:
- Search-powered log analysis and metrics correlation.
- Highly customizable data storage and visualization pipelines.
- Open-core ecosystem for extensibility and community support.
Hybrid Cloud Observability Tools
Best for on-prem + cloud environments where infrastructure continuity is key.
SolarWinds
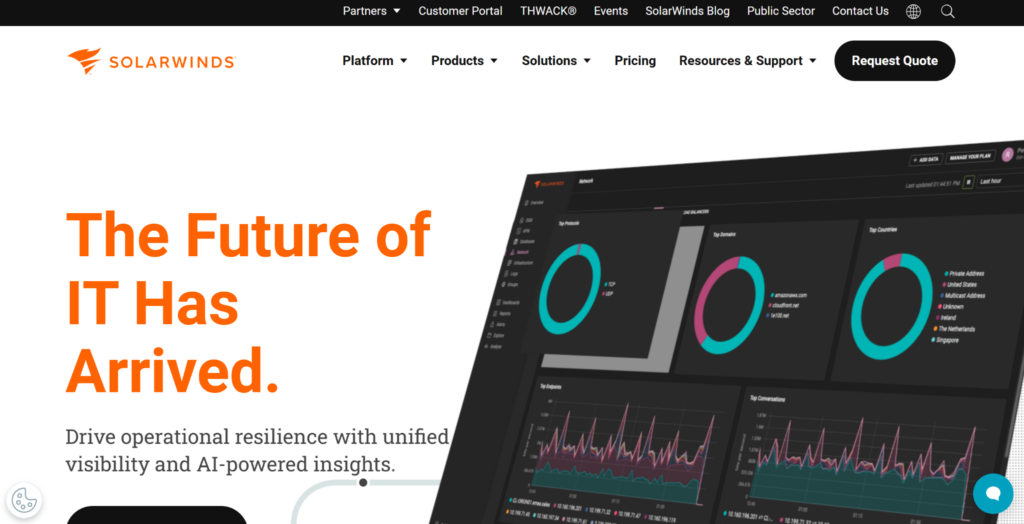
SolarWinds focuses on IT agility by offering cross-domain analytics and service dependency insights across hybrid IT environments. It provides end-to-end oversight that predicts problems before they impact users.
Key Observability Features:
- Strong roots in on-prem infrastructure and network monitoring.
- Expanding support for modern cloud services and containers.
- Best for IT teams managing legacy continuity alongside cloud velocity.
LogicMonitor
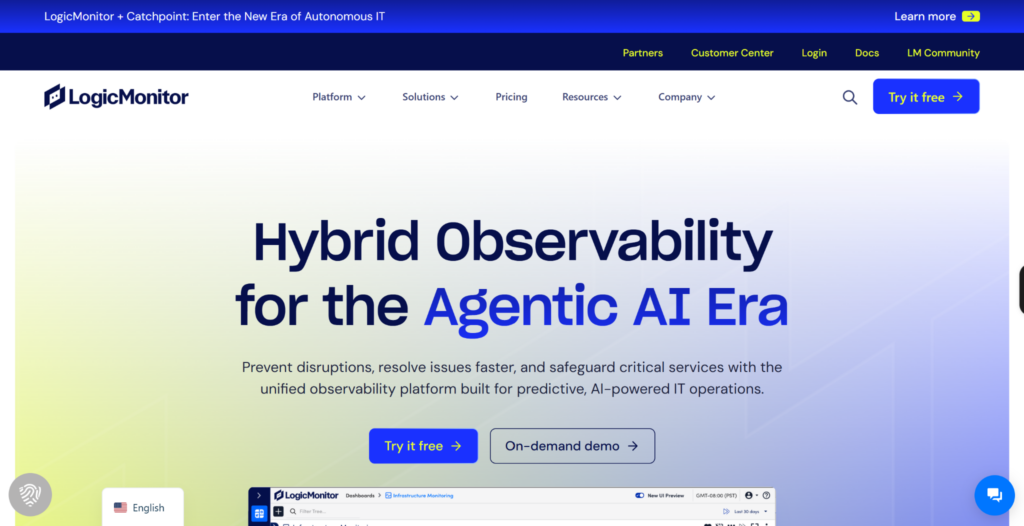
LogicMonitor utilizes agent-based monitoring to provide a unified view of hybrid infrastructure and data center resources. Its platform aims to move IT from reactive patching to faster, proactive resolution.
Key Observability Features:
- Unified view of on-prem data centers and public cloud infrastructure.
- Comprehensive alerting model with rapid deployment capabilities.
- Designed for infrastructure teams requiring immediate hybrid visibility.
IBM Instana
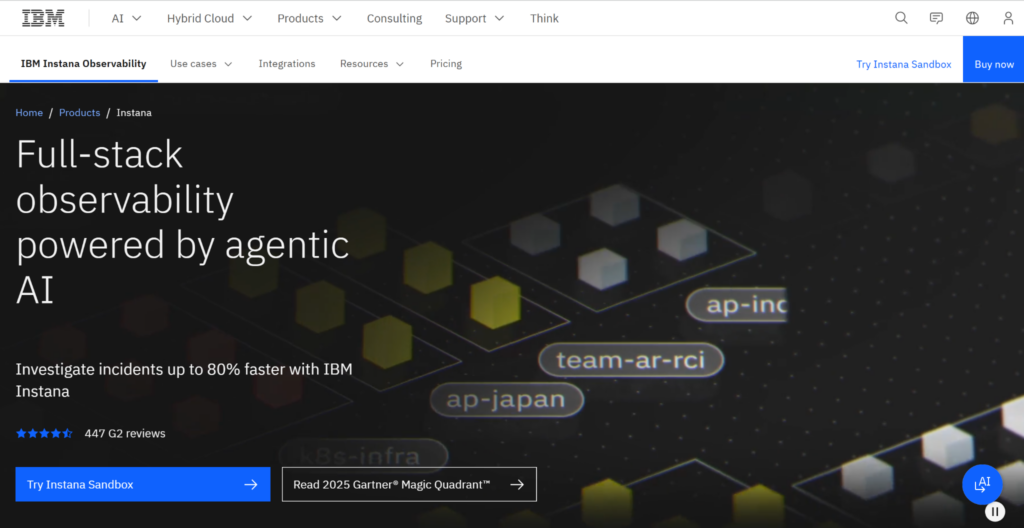
IBM Instana provides automated full-stack transparency with continuous data collection and end-to-end tracing. It contextualizes hybrid dependencies to give teams immediate visibility into dynamic, regulated systems.
Key Observability Features:
- Automated APM specifically designed for hybrid cloud awareness.
- Deep visibility into Kubernetes and middleware components.
- Enterprise-focused deployment model for regulated environments.
Multi-Cloud Observability Tools
Best for organizations using multiple hyperscalers (AWS, Azure, Google).
Grafana Labs
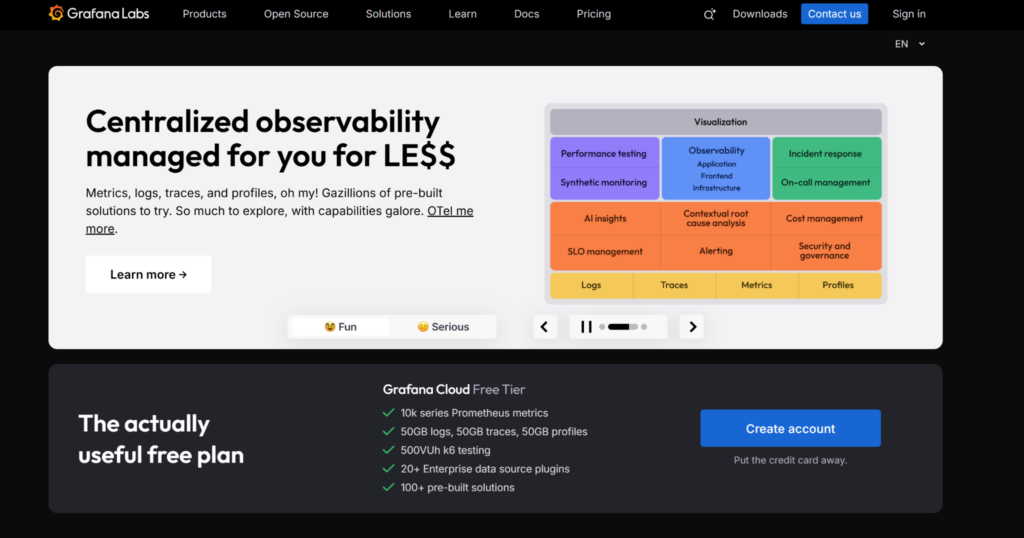
Grafana Labs emphasizes openness and composability, allowing organizations to build unified observability dashboards around shared data. It is a primary driver behind democratizing data across the entire organization.
Key Observability Features:
- Composable stack utilizing Prometheus, Loki, and Tempo.
- Strong community ecosystem with massive library of dashboard templates.
- Best for standardizing observability workflows across diverse clouds.
Chronosphere
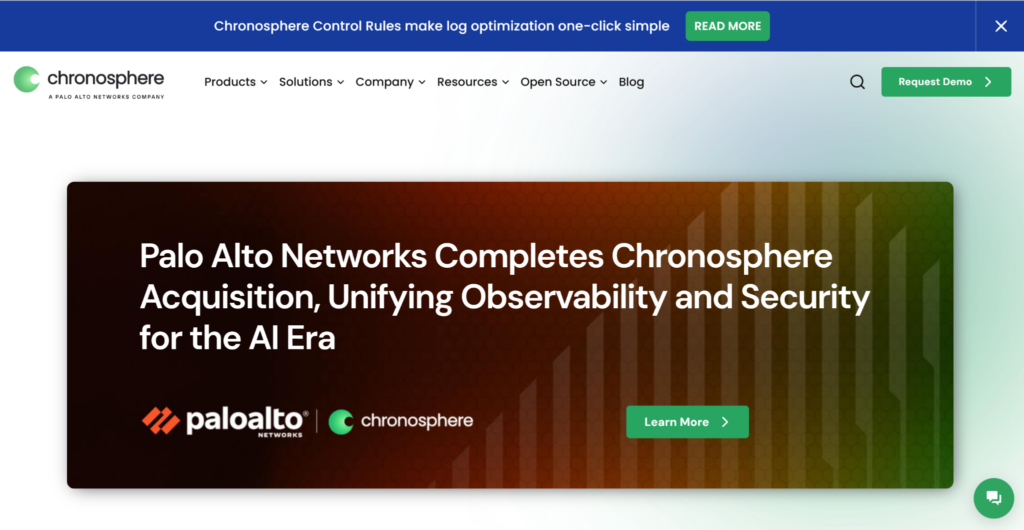
Chronosphere is purpose-built for massive scale, helping teams manage the high-volume data generated by distributed microservices. It unifies observability with data control to reduce the “data tax” of high-cardinality telemetry.
Key Observability Features:
- Telemetry control for filtering and normalizing data in-flight.
- Built specifically for the extreme scale of distributed cloud architectures.
- Best for teams hitting cost and volume limits with traditional tools.
AppDynamics
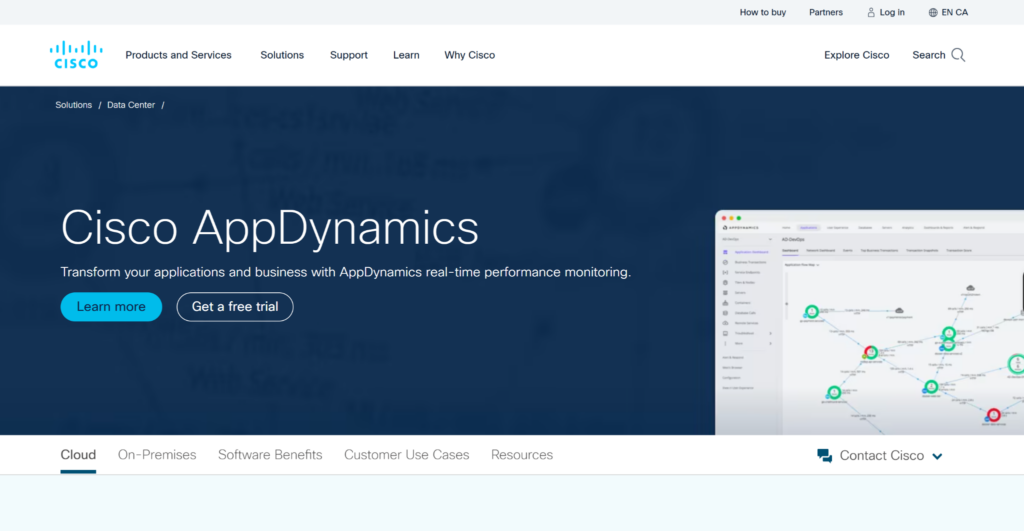
AppDynamics (Cisco AppDynamics) specializes in correlating hybrid application performance directly with business outcomes. It provides deep diagnostics to pinpoint bottlenecks in complex multi-cloud transactions.
Key Observability Features:
- Business transaction-centric monitoring across cloud providers.
- Strong governance models for large enterprise deployments.
- Best for correlating application health to specific business KPIs.
Lightstep
Lightstep (ServiceNow) leverages OpenTelemetry for vendor-neutral visibility and context propagation across distributed services. It helps engineers identify problematic factors causing system anomalies through advanced tracing.
Key Observability Features:
- Native OpenTelemetry support for instrumentation and data collection.
- High-performance distributed tracing for complex service journeys.
- Developer-centric workflows optimized for modern microservices.
Open-Source & Cloud-Native Building Blocks
Many teams build custom, vendor-neutral observability stacks using these foundational open-source projects, which serve as the primary building blocks for modern distributed systems.
Prometheus
As the de-facto standard for cloud-native metrics, Prometheus is a Cloud Native Computing Foundation (CNCF) project designed specifically for monitoring Kubernetes and microservices.
- Pull-Based Scaping: Unlike traditional systems that wait for agents to push data, Prometheus server proactively “pulls” metrics from configured HTTP endpoints at scheduled intervals.
- Dynamic Service Discovery: It features native integration with the Kubernetes API to automatically discover and track new pods and nodes as they are created or destroyed.
- Multi-Dimensional Data Model: Prometheus utilizes labels to add rich context to metrics, allowing engineers to slice and dice data by namespace, container name, or specific environment tags using its powerful query language, PromQL.
OpenTelemetry
OpenTelemetry (OTel) is a standardized, vendor-neutral framework for the generation, collection, and export of telemetry data (metrics, logs, and traces).
- Universal Instrumentation: OTel provides a consistent set of APIs, SDKs, and libraries across popular programming languages like Go, Java, and Python, ensuring context flows seamlessly across distributed services.
- Telemetry Pipeline Control: The OpenTelemetry Collector acts as a central hub that unifies data collection; it can receive data from various sources, process it (batching, filtering), and then export it to multiple backends simultaneously.
- Future-Proofing: By decoupling data collection from the analysis backend, it prevents vendor lock-in, allowing organizations to switch observability platforms without re-instrumenting their entire code base.
Jaeger
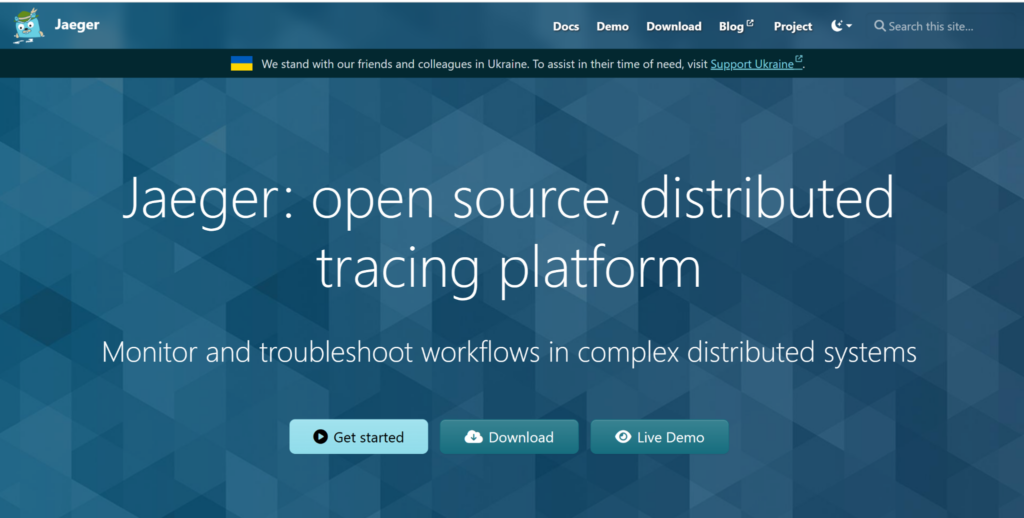
Jaeger is a highly scalable, end-to-end distributed tracing system originally developed at Uber and now a graduated CNCF project.
- Distributed Transaction Monitoring: It follows single-user transactions as they traverse multiple microservices, stitching together discrete “spans” to visualize the entire request journey.
- Advanced Root-Cause Analysis: Jaeger’s UI provides detailed span timeline views and service dependency graphs, helping teams quickly pinpoint which specific service is introducing latency or causing error propagation.
- Adaptive Sampling: To manage processing overhead in high-volume systems, Jaeger supports adaptive sampling that dynamically adjusts how many traces are captured based on current traffic patterns.
Zipkin
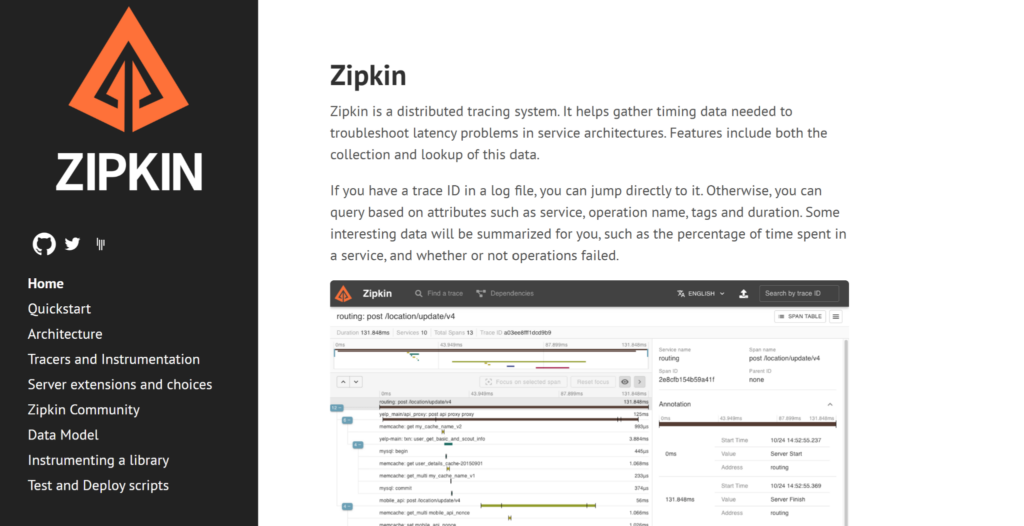
Zipkin is a lightweight distributed tracing system based on Google’s Dapper paper, specifically designed for troubleshooting latency problems in service architectures.
- Minimalistic and Easy Deployment: With its simple architecture, Zipkin is often the go-to for smaller deployments or teams needing to quickly visualize latency hotspots with minimal configuration.
- Broad Ecosystem Support: It offers extensive library support for diverse languages including C#, Ruby, Scala, and PHP, as well as native integrations with transports like Apache Kafka and RabbitMQ.
- Dependency Diagramming: The platform automatically generates dependency diagrams that show how services interact, which is critical for understanding system structure and identifying aggregate error paths.
NZO Cloud: Achieving Total Visibility Through Control

For organizations with high-demand workloads, standard observability tools often reveal a frustrating truth: virtualization and “noisy neighbors” in public clouds create performance “fog” that is impossible to clear. While traditional monitoring identifies these issues, it rarely provides the control necessary to fix them. NZO Cloud addresses this by giving users complete control over their cloud computing and storage resources, ensuring full visibility into every aspect of the environment.
Control Your Costs
Traditional cloud vendors utilize a “pay-per-service” model that often leads to budget loss due to unexpected egress fees and licensing add-ons. NZO Cloud provides a different approach through standardized subscription pricing.
- Fixed Monthly Fees: Organizations receive a single, simple price for all computing and storage needs, eliminating the guesswork of monthly budgeting.
- No Surprise Charges: By removing data transfer fees and additional licensing costs, organizations can utilize 100% of their allocated resources without cost penalties for experimentation or failed runs.
Control Your Design
Every organization has unique needs, yet traditional providers offer very limited HPC configurations. NZO Cloud allows users to design custom cloud instances tailored to their specific applications.
- Custom Configurations: Working with specialized engineers, users can specify granular requirements for processors, memory, GPUs, and network interconnects.
- Bare-Metal Infrastructure: By providing dedicated computing resources rather than virtualized slices, NZO Cloud ensures that engineers have a clear view of the actual hardware performance without hypervisor interference.
Control Your Performance
In shared cloud environments, performance is often unpredictable due to resource sharing among multiple users. NZO Cloud offers predictable, reliable, and repeatable performance benchmarks.
- No Bottlenecks: By eliminating virtualization and system resource sharing, NZO Cloud provides 100% dedicated resources accessible only by your organization.
- Real-Time Monitoring: Included as part of the Cloud HPC Orchestrator, organizations gain a web-based view of key metrics such as CPU usage, memory utilization, and job cues.
Control Your Access & Security
Cloud security is often a major hurdle for organizations moving workloads from on-premise resources. NZO Cloud simplifies security by providing total access control over the environment.
- Dedicated Firewall: Every customer receives a secure firewall configured personally by the user, allowing for complete control over every connection.
- Federated Data Control: Data is accessible only through a secure firewall and can be further protected with an optional Bastion Box and dedicated internet connections.
- Certified Security: NZO Cloud infrastructure meets federal standards, including ISO 27001 certification and ITAR compliance, with FedRamp authorization in progress.

Conclusion: Key Takeaways for Buyers
The best observability tool depends on your architectural journey. General tools like Datadog excel in depth but assume architectural consistency. Hybrid tools like SolarWinds optimize for infrastructure continuity. Multi-cloud tools like Grafana Labs prioritize standardization and scale over provider-specific detail.
However, the most effective observability strategy is one that aligns with your bottom line. For data-intensive projects, NZO Cloud provides total control over cost, performance, and security.
- Predictable Budgeting: Unlike the “tick-tick-tick” of charges from traditional vendors, NZO offers fixed subscription pricing with no surprise charges and no additional data transfer fees.
- Custom Design: PSSC Labs allows you to design your cloud instances from the component level up—selecting the exact processors, memory, and GPUs needed for your specific performance metrics.
By combining modern observability tools with a dedicated, custom-engineered cloud infrastructure, engineering managers and data scientists can finally take back control of their environments, delivering projects on time and on budget.
Start a free trial with NZO Cloud today, or contact PSSC Labs to discuss building your customized cloud infrastructure.